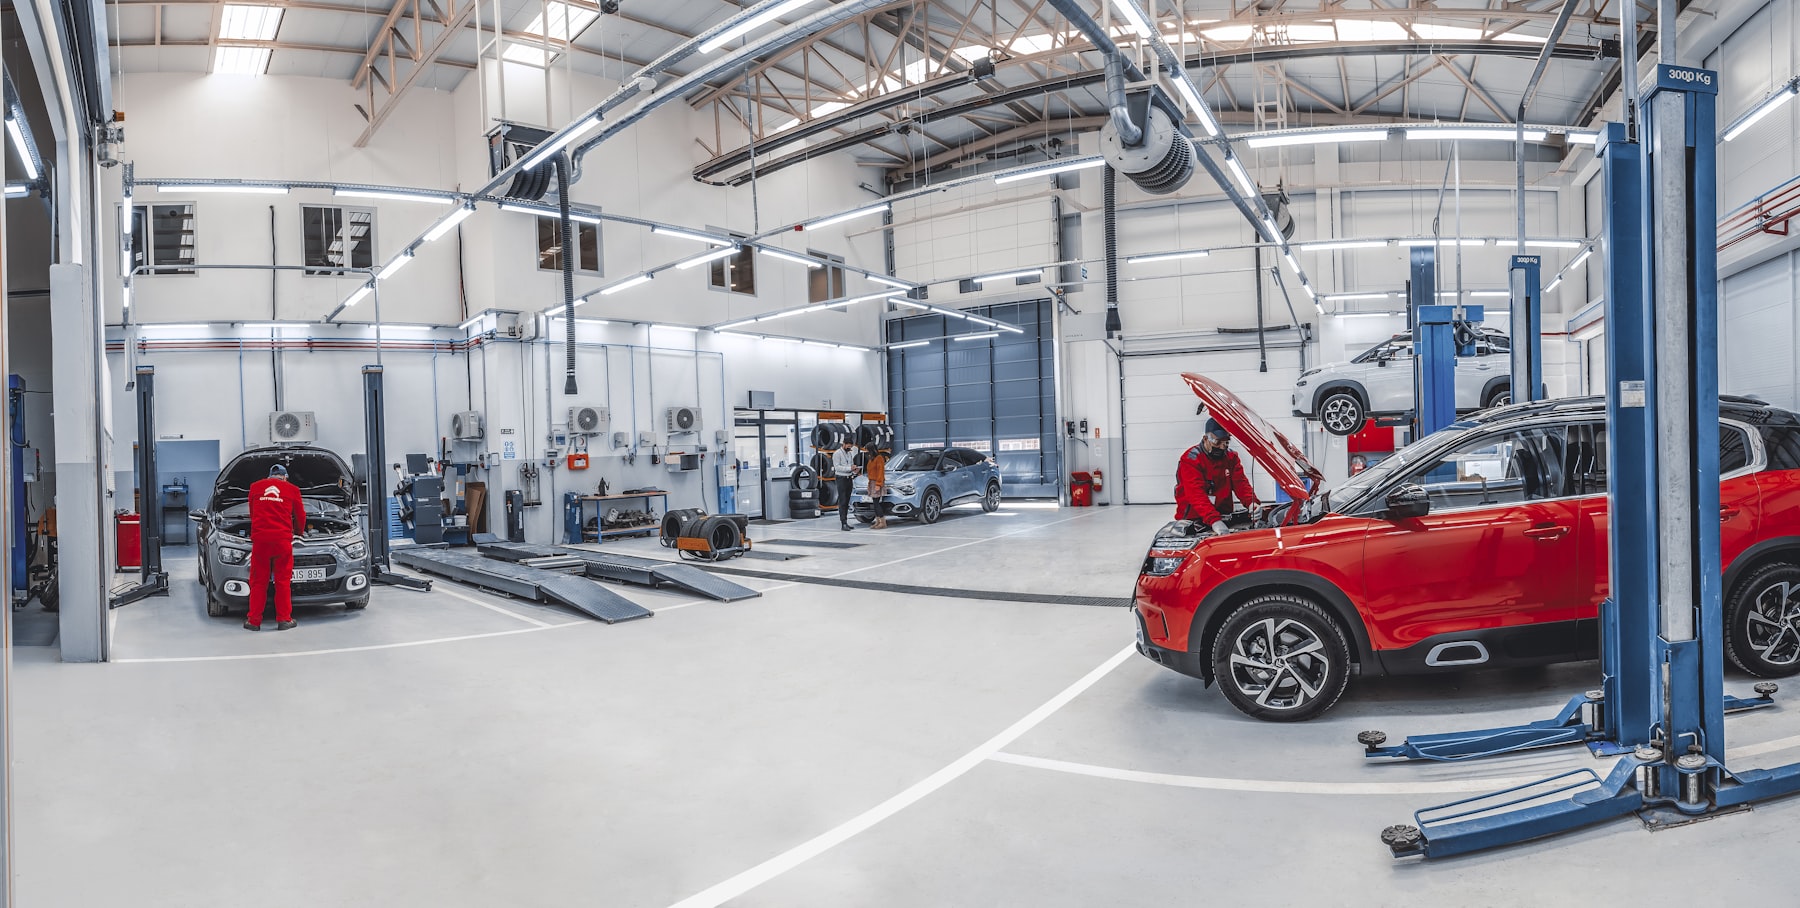
A shop owner in Bixby asked me a fair question: does the Tulsa County trade data say anything useful about auto repair, or is it just background noise? Most of the trades I've covered in this series have a real structural story behind them, roofing's demand outrunning its own saturation, finish carpentry running short-handed relative to what people are searching for, site preparation barely getting searched at all because it's a subcontractor trade. Auto repair doesn't have one of those stories. Every number I can pull for it (location quotient, establishment count, search-interest ratio) lands close to the middle of the pack. That's not a non-answer. It's the answer, and it changes what's actually worth doing about marketing a shop here.
What "Balanced" Actually Means in This Number
Location quotient measures how concentrated a trade is in Tulsa County relative to the national average, where 1.0 is exactly average. Auto repair's location quotient is 0.91, not 1.5, not 0.5, just modestly below the national baseline, per the county's establishment and employment figures in the Tulsa Trade Data project. Compare that to roofing at 1.88 (Tulsa County has nearly double the roofing contractors you'd expect for its population, driven by Oklahoma's hail corridor) or site preparation at 0.44 (less than half the expected count, because that trade is mostly booked through general contractors, not homeowners).
Auto repair sits nowhere near either extreme. There isn't a shortage of shops relative to demand, and there isn't an oversupply either. At 169 establishments countywide, it's a market with room for good and bad operators to coexist, without the data forcing either outcome.
The Demand Side Says the Same Thing
Google search demand backs this up independently. On the Tulsa Search Demand Data project's five-year Google Trends average, "auto repair" posts a search interest index of 18.0: respectable, not remarkable, and squarely in the middle third of the 15 tracked trades. Dividing that interest by the 169 establishments gives an interest-per-business ratio of 0.107, which lands almost exactly mid-pack: well below car washes' standout 0.793 (real demand outpacing a small number of businesses) and well above site preparation's 0.001 (a trade nobody searches for directly), but nowhere near either edge. Two independent data sources (BLS employment data and Google search behavior) arrive at the same conclusion from different directions: this is a trade without a demand-side story to point to.
No Tailwind Doesn't Mean No Headwind Either
It's worth being honest about what this isn't. It isn't evidence that auto repair is a bad business to be in, and it isn't a warning sign either. A trade with a location quotient this close to 1.0 and a demand ratio this squarely mid-pack simply doesn't have a structural argument in either direction: no wave of under-served demand to catch, but also no crowded market to worry about surviving in.
For a shop owner deciding where to put marketing budget, that's genuinely useful information, because it rules out a certain kind of thinking. There's no data-backed case here for "just show up and demand will carry you," and there's no data-backed case for "this market is too saturated to bother." Both of those stories exist for other trades in this dataset. Auto repair doesn't get either one.
Where the Real Competitive Edge Comes From Instead
When the countywide numbers don't hand anyone an advantage, the businesses that actually pull ahead are winning on the parts of the picture still fully in their control: how fast they respond to a call, how consistently they're asking for and earning reviews, and whether their Google Business Profile and website are actually set up to be found for the specific repair someone's searching, not just the generic trade name.
I wrote a separate deep dive on one piece of that, the map-pack and reviews angle, using a Collinsville shop as the example, but the mechanics of review velocity work the same way in Bixby. That post is worth reading alongside this one, because it's the execution-level answer to the question this post's data can't answer: there's no shortcut sitting in the countywide numbers, so differentiation has to come from doing the fundamentals better than the shop two miles away.
What This Means for a Bixby Shop Specifically
One caveat worth stating plainly: none of these figures are Bixby-specific. The Quarterly Census of Employment and Wages and Google Trends both report at the county level or broader, not down to individual suburbs, so a Bixby shop's actual local competitive picture, how many other shops sit within a five-minute drive, how active their profiles are, can look different from the countywide average even though the county-level story is balanced. That's not a gap unique to this post; it's how BLS QCEW publishes county-level figures generally. The countywide numbers say there's no structural tailwind or headwind for the trade as a whole. What happens inside Bixby itself is still a local question, answered by looking at the specific shops actually competing there, not by the county average alone.
- Location quotient of 0.91 means auto repair is close to nationally average concentration in Tulsa County, not over- or under-represented.
- Interest-per-establishment ratio of 0.107 is mid-pack among the 15 tracked trades: no demand-side story to point to either way.
- With no structural advantage or disadvantage, execution (reviews, response time, local SEO fundamentals done consistently) is what actually separates shops.